Create an interactive work tracking data from a distance space (real or virtual one). The data can be tracked from internet (social networks for example), from audio and video streams or from “world data” (weather, wind, rain, planes traffic, tides, gps data etc.). Once the data have been collected, find a way to create a visualization of them, and to print them. The project must cover the topic of surveillance. The project must maintain a certain coherence from the data to the print, and deal with an interesting subject exploring the idea of surveillance in a distance space. The project may be produced individually or in groups. All work must be presented and documented.
Summary
Create an interactive work / installation around the idea of Surveillance.
1) Get the data from outer space
2) Display the data
3) Print the data
Document you project during the creation and the building process.
Help
Try to set up a project with an automated process from the beginning (getting the data), to the end (printing).
To create a good and interesting project, you have to know the answer to those questions:
For who ?
For what ?
How ?
Where ?
What are the elements you put into your project ?
political discourse ?
for (serious) fun ?
esthetical dimension ?
technical challenge ? Innovation ?
philosophical purpose ?
...
What questions are you raising in your project ?
Course 7
Displaying Data - CSS - Twitter API
CSS Positioning and Responsive
Positioning Elements
relative
The following CSS rule sets div to be relative with a top and left property.
div {
   position: relative;
  top:10px;
  left: 45px;
}
absolute
The following CSS property removes the div from the flow, and places it according to the position of its closest parent that is relative (or to the body).
div {
  position: absolute;
  top:10px;
  left: 45px;
}
So if we set the .container to be position: relative, then we change the point of reference used for the absolute positioning of its child div.
.container {
  position: relative;
}
fixed
Fixed is used to place elements always in view, such as a navigation bar or a pop-up.
div{
  position:fixed;
  top:10px;
  left: 45px;
}
Columns and grid
First method : inline-block
div {
    width: 23%;
    display: inline-block;
    vertical-align: top;
}
To set the width of an element and be sure it won't change, we need to add the CSS property box-sizing to border-box on all elements in the browser (to target all HTML nodes, we use the * selector). So basically, this is what we get:
 * {
  box-sizing: border-box;
}
Second method : Float and Clear
Float can determine how text flows around an image or other block element.
It can also be used to make elements float put adjacent to each other to create adjustable layouts. Float values can be left, right, or center (or none).
Clear determines whether elements can float on each side.
Clear values can be left, right, both, none.
If clear is set to right, no elements can float to the right.
Finally, CSS3’s flexbox can be used to create more complex layouts that were previously difficult such as equal height columns or vertical alignment.
Note that only new browsers will support flexbox. https://css-tricks.com/snippets/css/a-guide-to-flexbox/
Responsive CSS
Responsive design for the web refers to making web layouts that can adjust to different devices’ screen resolution. It is accomplished using html and css. Involves adjusting layouts using percentages for widths of elements as well as changing the layout depending on the viewport size.
This indicates that the layout of the page corresponds to the width of the current device’s viewport so that the device does not attempt to scale or zoom the content.
Media Queries
Media queries are rules that allow css to adjust the layout based on certain breakpoints and positions. Many designers begin designing for the smallest layout (usually mobile) and use media queries to adjust for increasingly larger screen widths.
This often uses breakpoints with min-width rules.
If a screen’s width is at least 600px wide the layout expands for example.
Mobile First !
Simple example
@media only screen and (min-width: 600px) {
    body{
        background-color: red;
    }
}
@media only screen and (min-width: 768px) {
    body{
        background-color: #FFF;
    }
}
Grid example
Most responsive layouts rely on a grid usually depending on defining column widths.
Media queries can then be used to adjust width sizes based on the device viewport.
This can be a useful method for creating layouts, but sometimes means adding extra container tags (that don’t relate to content structure) and non-semantic classes.
There are many responsive design frameworks of varying complexity that can be used in developing sites. Some designers prefer to use them for ease of use, while others believe they are slower and include unnecessary extras for many sites.
Two of the most commonly used frameworks are: Bootstrap and Foundation,
Node.js is a JavaScript runtime built on Chrome's V8 JavaScript engine. Node.js uses an event-driven, non-blocking I/O model that makes it lightweight and efficient.
In other words: Node.js offers you the possibility to write servers using JavaScript with an incredible performance. As the official statement says: Node.js is a runtime that uses the same V8 Javascript engine you can find in the Google Chrome browser.
Now we will go to http://dev.twitter.com to generate
1.consumer_key
2.consumer_secret
3.access_token
4.access_token_secret
They are secret keys and access tokens which give access to use the twitter API and let you play around with your account through your application/project.
(First, if you have no twitter account, or want to create a new one for your project, create a new one)
Step 1. Go to https://apps.twitter.com/
Step 2. On top right you will find ‘Create new app’
Step 3. Fill in your details Name, Description, website and agree to the Agreement
Step 4 . Create your twitter Application
Step 5. Go to keys and access token, find your keys there
Step 6. Hit Create my access token and generate access token
Go to the main.js file and change the different by your keys
consumer_key: 'CONSUMER KEY',
consumer_secret: 'CONSUMER SECRET',
access_token: 'ACCESS TOKEN',
access_token_secret: 'ACCESS TOKEN SECRET'
An application programming interface (API) is a set of routines, protocols, and tools for building software and applications. It's a set of functions that a service give you access to.
An API may be for a web-based system, operating system, or database system, and it provides facilities to develop applications for that system using a given programming language. As an example, a programmer who develops apps for Android may use an Android API to interact with hardware, like the front camera of an Android-based device.
Some APIs Example :
Facebook, Twitter, Instagram, Google Maps, Open Street Map, Souncloud, Youtube, Weather API…
You can find a list of public APIs here -> https://github.com/toddmotto/public-apis
How does it work ?
With API we can manipulate data.
Two types of requests :
the GET Requests: for read only (for example to get all the tweets from a specific hashtag)
the POST Requests: for anything that will change the data on the server (for example posting on Facebook or writing a tweet)
The data is usually wrapped in some standard format such as JSON (Javascript Object Notation) or XML, to make it easy to manipulate.
Create an interactive work tracking data from a small space (room, elevator, stairs etc.). The data must be localized and be part of the small space you have chosen. They can be tracked from bodies (movement, face detection, sensors, voices, etc.), from the space itself (noise, light, temperature, videos, photos, etc.) or from the local network (piratebox, connection packages, etc.). Once the data have been collected, find a way to create a visualization of them, and to print them. The project must cover the topic of surveillance. It must maintain a certain coherence from the data to the print, and deal with an interesting subject exploring the idea of surveillance in a close space. The project may be produced individually or in groups. All work must be presented and documented.
Summary
Create an interactive work / installation around the idea of Surveillance.
1) Get the data from inner space
2) Display the data
3) Print the data
Document you project during the creation and the building process.
Help
To create a good and interesting project, you have to know the answer to those questions:
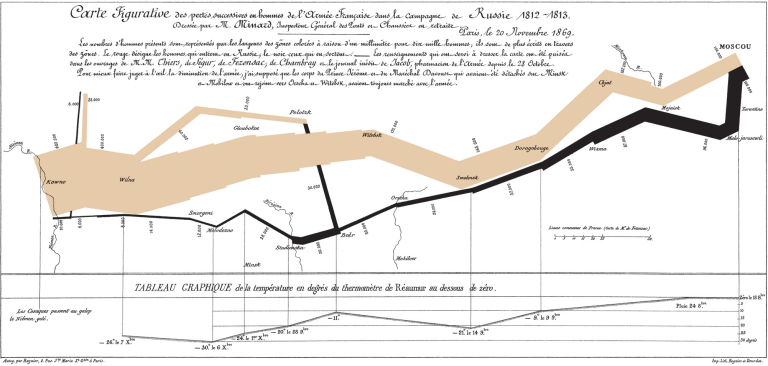
CHARLES MINARD’S FLOW MAP OF NAPOLEON’S RUSSIAN CAMPAIGN OF 1812
Probably the best statistical graphic ever drawn, this map by Charles Joseph Minard portrays the losses suffered by Napoleon's army in the Russian campaign of 1812. Beginning at the Polish-Russian border, the thick band shows the size of the army at each position. The path of Napoleon's retreat from Moscow in the bitterly cold winter is depicted by the dark lower band, which is tied to temperature and time scales.
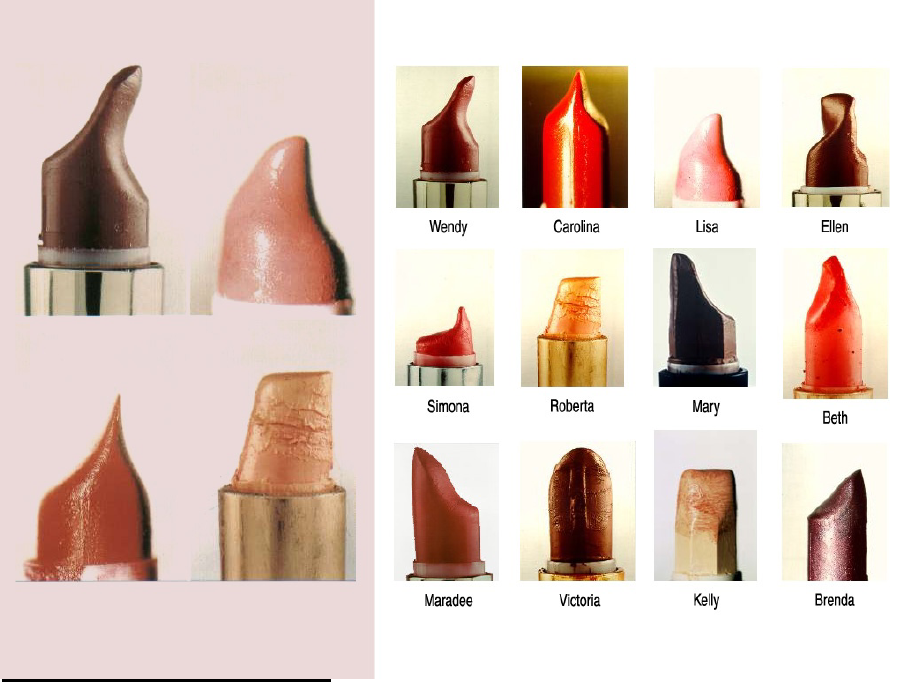
Lipsticks, Stacy Greene
Stacy Greene documented the lipsticks owned, and unconsciously “sculpted”, by her friends. Although there is no quantitative data here, these objects offer richly multidimensional qualitative information about their owners: hints about their complexion, their fastidiousness, and the 6-dimensional rotations of a repetitive gesture in space. [http://www.stacygreene.com/lipstick.html]
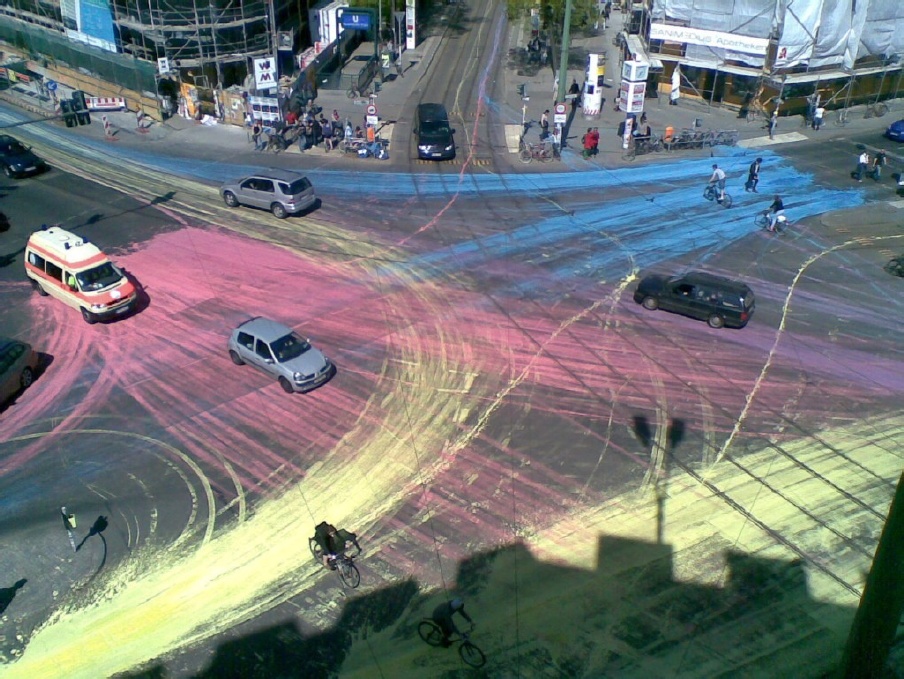
Painting Reality, Aziz Ikon
Visualization of traffic in Berlin’s Rosenthaler Platz
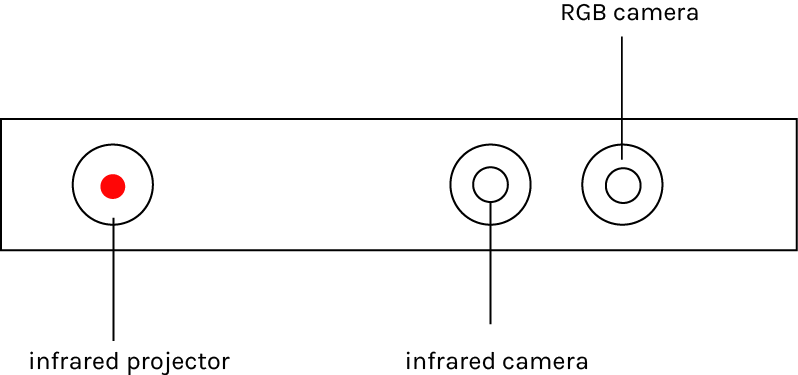
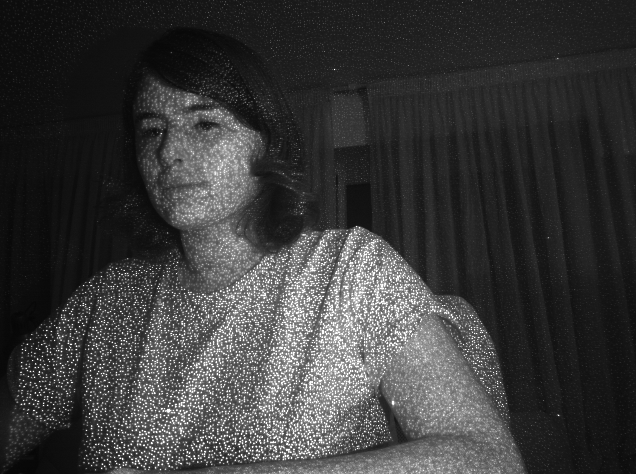
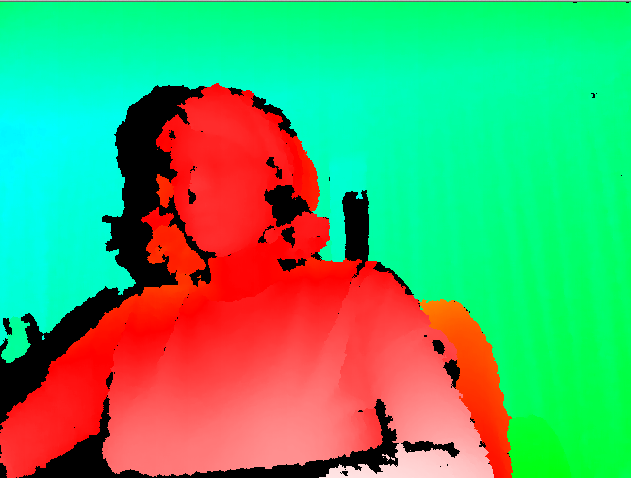
The Kinect is projecting a pattern of dots ans analyse the distorsion of the dots. It detects which one is closer and which one is deeper. The closer, the darker - the deeper the brighter. For the kinect v1, the raw depth values range between 0 and 2048.
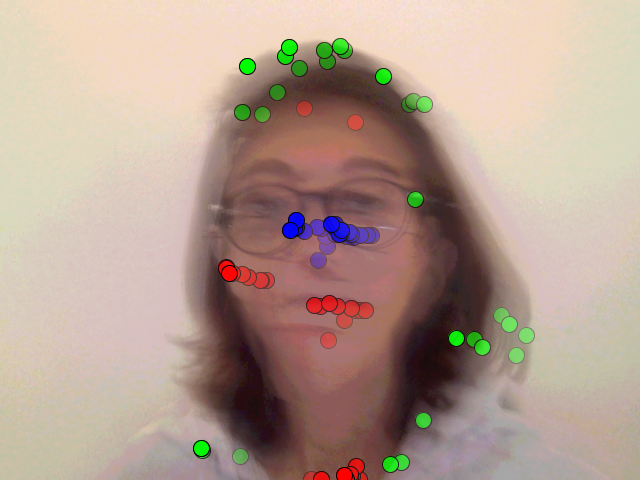
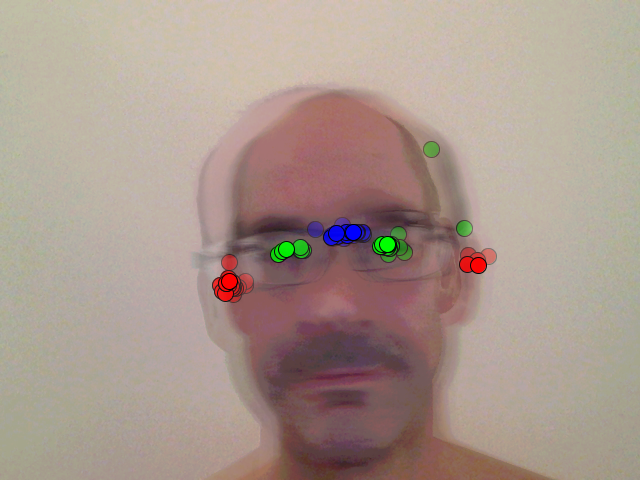
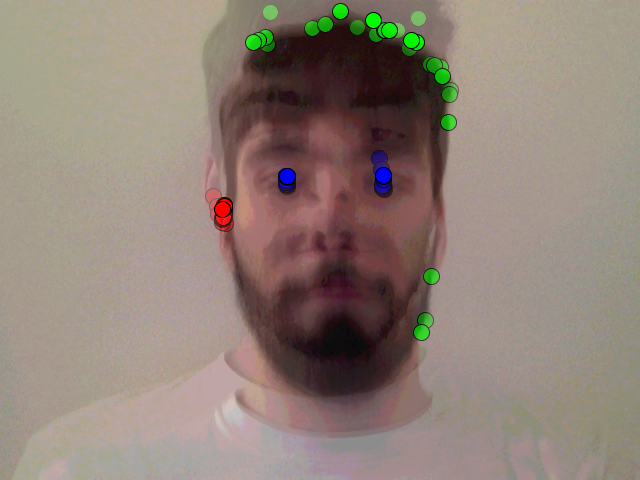
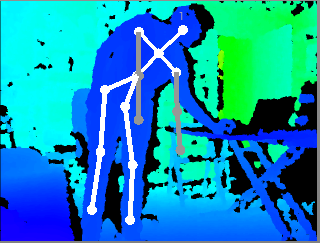
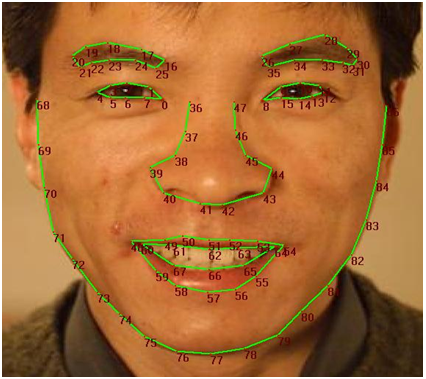
Face Tracking is a technology to identify and follow movement of human face.
It's based on specific face points (mouth, nose, eyes, eyebrown...), that every human being have in common, to detect the movement of mouth, eyes, face etc...
Use one or some tools / technologies to get data from a small space
Document it with your protocol
Course 1
Introduction
Course Description
The goal of the Spatial Lab is to explore space perception and interaction through digital technologies. This course provides production skills and processes for projects in Core Studio: Space. How can we read and write to our known environment? What new spaces can we create? How the distance can change our perception?
Students will learn to fabricate and prototype physical installations and objects, as well as expand their knowledge and application of programming and physical computing for interactive environments, objects and processes. Students evolve their understanding of production and trouble shooting and develop their own skills and perspectives. Students will experiment with sensors to track the human body, its movements and gestures, learn to collect and visualize large data sets. Students will work on two projects approaching the idea of surveillance.
Surveillance - Data → Screen → Print
Project 1: Inner Space
Create an interactive work tracking data from a small space (room, elevator, stairs etc.) The data must be localized and be part of the small space you have chosen. They can be tracked from bodies (movement, face detection, sensors, voices, etc.), from the space itself (noise, light, temperature, videos, photos, etc.) or from the local network (piratebox, connection packages, etc.). Once the data have been collected, find a way to create a visualization of them, and to print them. The project must cover the topic of surveillance. It must maintain a certain coherence from the data to the print, and deal with an interesting subject exploring the idea of surveillance in a close space. The project may be produced individually or in groups. All work must be presented and documented.
Create an interactive work tracking data from a remote space (real or virtual one). The data can be tracked from internet (social networks for example), from audio and video streams or from “world data” (weather, wind, rain, planes traffic, tides, gps data etc.). Once the data have been collected, find a way to create a visualization of them, and to print them. The project must cover the topic of surveillance. The project must maintain a certain coherence from the data to the print, and deal with an interesting subject exploring the idea of surveillance in a remote space. The project may be produced individually or in groups. All work must be presented and documented.
Source code (it can be great to comment your code to explain it)
Technical explanation (circuit, how to reproduce it)
Normally with a good documentation you can reproduce the project.
What for?
First, documentation is for yourself.
Secondly, documentation is for the community.
How to?
Create you own documentation system / protocol.
The protocol should include the capture part of the documentation (pictures, videos, screenshots, code etc.) and the publication part of it (pdf, blog etc...).
The system should be use to document digital and physical projects and should be easily accessible online.
Assignment for next week
Create your documentation protocol and try it by documenting itself. Next week you will make a presentation with your documentation.
Ressources / Examples about documentation
Capture
camera (pictures / videos)
drawings
sounds
Here a bash script that takes a screenshot every x seconds: timed_capture
To make it works:
1) change the outputfolder variable and add the path of the folder you want to save your screenshots.
2) change the delay (in seconds).
3) open the Terminal, go to the folder where you saved the script: sudo path/to/folder
4) launch the script: bash timed_capture.sh